This blog sequence is also available as a PDF document.
Wherever you celebrate, it is also drunk, certainly not only shower and juice but also completely different things. But before you get behind the wheel, you should keep the blood alcohol mirror in sight as a precaution, otherwise, the fun quickly has a hole in the fine and flutters into the house due to drunkenness in road traffic. The second post from the series shows how you can check your alcohol consumption in terms of measurement technology
Micropython on the ESP32 and ESP8266
today
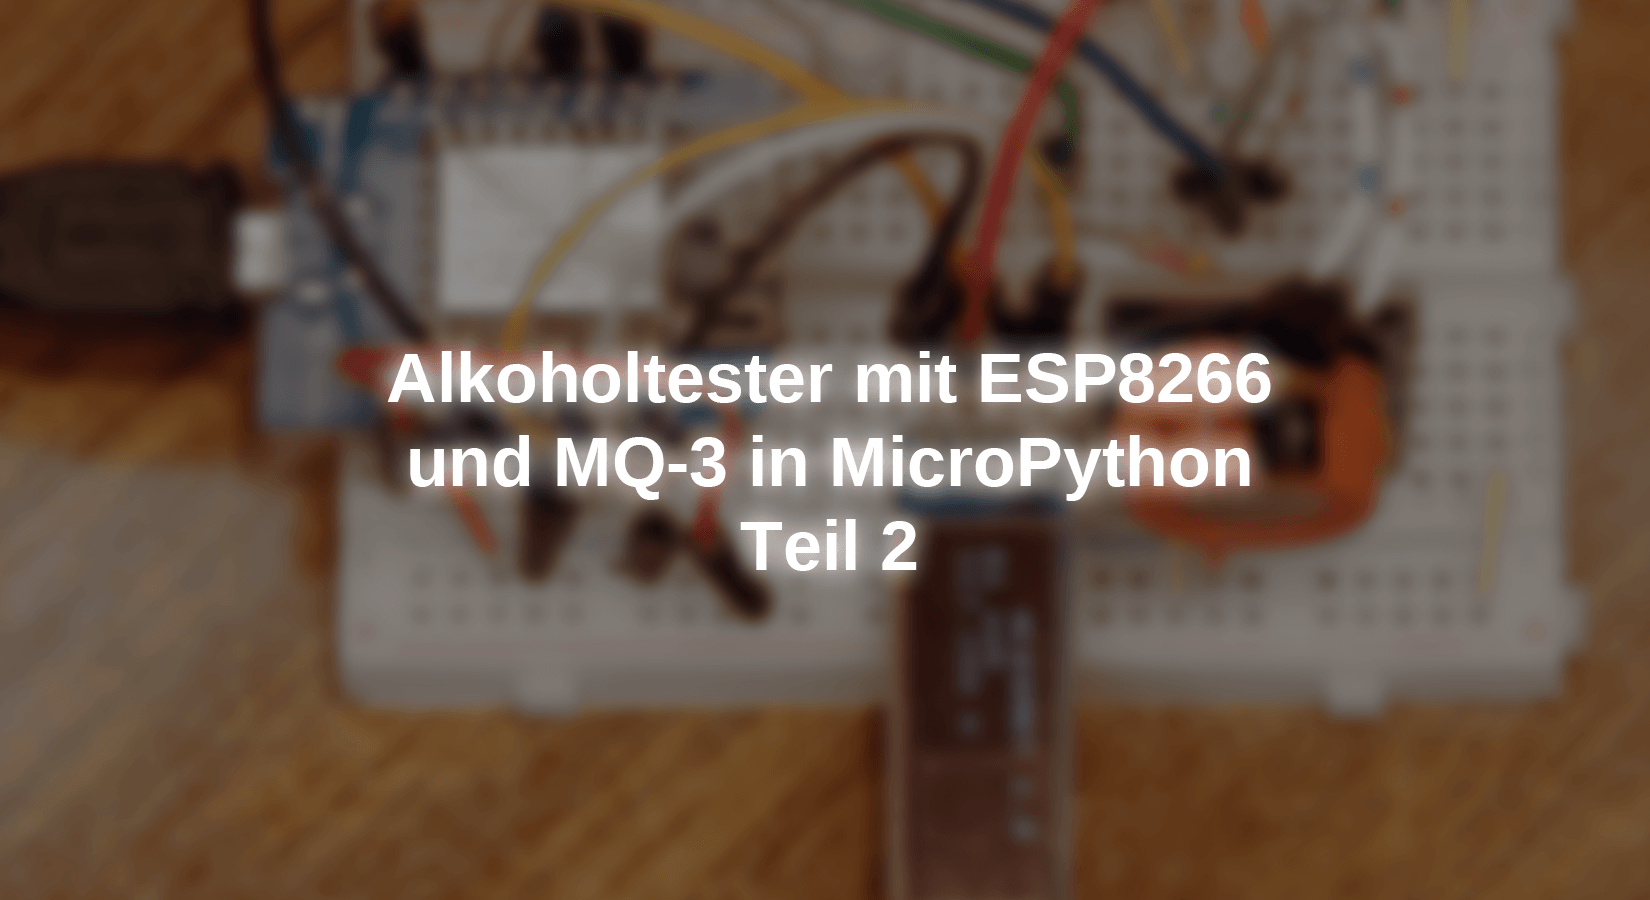
An Alkometer with the ESP8266 and an MQ-3 gas sensor-Part 2
In addition to the program, this part is also about the background for the evaluation of a diagram, as can be found in the datasheet of the MQ-3. After all, we need a formula that allows the measured sensor voltage to put the measured sensor voltage into an alcohol concentration. A little math is necessary for this.
We already have the technical and program-related background in Part 1 treated on the subject of Alkometer. Nothing has changed in the circuit, not even on the components used. The functions from Part 1 are also recycled in this episode. A few new ones have been added, I will discuss them below. For the previous reasons, only the self-experiment remains for the calibration of the device. Here again, is the procedure.
After a look in the Catalog of fines Could it look that way? If you double the value of the breathing air concentration, you get the blood alcohol level. In other words, I get the breathing air concentration by halving the blood value. The latter can be calculated. An example, this time female:
A woman with 70kg body mass has 70kg • 0.6 = 42kg body fluid. The reduction factor in men is 0.7. It drinks 0.5l of wine = two pipes with an alcohol content of 12.5 % vol. In the wine, 500cm³ • 12.5 / 100 = 62.5 cm³ pure alcohol. Pure alcohol has a density of 0.79g/cm³, so the 62.5 cm³ has a mass of 42.5 cm³ • 0.79g/cm³ = 49.4g. In relation to 42kg body fluid, this is 49.4g / 42kg = 1.18 per thousand. And that would result in a breathing air concentration of almost 0.59 per thousand or 0.59mg alcohol/liter breathing air. However, the wine would have to be drunk on one train if possible, because the liver reduces by 0.15 per thousand per hour. However, only you can decide whether you are still able to calibrate your structure after enjoying two Schoppen wines to calibrate your structure.
Hardware
I chose an ESP8266 as a controller because it has a reasonably linear ADC characteristic. Basically, an ESP32 would also be useful, but it causes a higher effort for the straightening of the characteristic line. I'll come back to it later.
The first three ESP8266 models in the partial list have the advantage that the voltage of the USB connection is available on the connection VIN / 5V. This saves an additional power supply or a battery during development. A power supply is recommended for later operation as a stand-alone device, because batteries or a battery are quickly sucked, after all, the heating of the MQ-3 150 MA and the ESP8266 pulls another 20 mA.
|
1 |
D1 Mini Nodemcu with ESP8266-12F WLAN module or D1 Mini V3 Nodemcu with ESP8266-12F or |
|
1 |
|
|
1 |
|
|
1 |
MOREGAND ROTARY POTENITOMENT with protective resistance 3590s 10k ohm |
|
1 |
|
|
1 |
|
|
1 |
|
|
|
Various jumper cable |
|
1 |
Resistance 4K7 |
|
2 |
Resistance 10k |
|
2 |
Resistance 390 Ohm |
|
1 |
The software
For flashing and the programming of the ESP32:
Thonny or
Used firmware for the ESP8266:
Used firmware for the ESP32:
The micropython programs for the project:
SSD1306.PY Hardware driver for the OLED display
oled.py API for the OLED display
Calibrate.py Program for calibrating the ADC
Heat. Py Program for determining the preheat duration of the MQ-3
alktest.py Program for testing the breath alcohol level
Micropython - Language - Modules and Programs
To install Thonny you will find one here Detailed instructions (English version). There is also a description of how the Micropython firmware (As of 18.06.2022) on the ESP chip burned becomes.
Micropython is an interpreter language. The main difference to the Arduino IDE, where you always flash entire programs, is that you only have to flash the Micropython firmware once on the ESP32 so that the controller understands Micropython instructions. You can use Thonny, µpycraft, or ESPTOOL.PY. For Thonny I have the process here described.
As soon as the firmware has flashed, you can easily talk to your controller in a dialogue, test individual commands and see the answer immediately without having to compile and transmit an entire program beforehand. That is exactly what bothers me about the Arduino IDE. You simply save an enormous time if you can check simple tests of the syntax and hardware to try out and refine functions and entire program parts via the command line before knitting a program from it. For this purpose, I always like to create small test programs. As a kind of macro, they summarize recurring commands. Whole applications then develop from such program fragments.
Autostart
If the program is to start autonomously by switching on the controller, copy the program text into a newly created blank tile. Save this file under boot.py in WorkSpace and upload it to the ESP chip. The program starts automatically the next time the reset or switching is on.
Test programs
Programs from the current editor window in the Thonny-IDE are started manually via the F5 button. This can be done faster than the mouse click on the start button, or via the menu run. Only the modules used in the program must be in the flash of the ESP32.
In between, Arduino id again?
Should you later use the controller together with the Arduino IDE, just flash the program in the usual way. However, the ESP32/ESP8266 then forgot that it has ever spoken Micropython. Conversely, any espressif chip that contains a compiled program from the Arduino IDE or AT-Firmware or Lua or ... can be easily provided with the Micropython firmware. The process is always here described.
The alk tester

Image 1: Alkomat - circuit
Here again the circuit. I have already described them in detail in Part 1. There you will also find a description of the objects, functions, and variables, which uses the main program described below.
There are 4 new functions that complement the previous block. trap() takes the sensor resistance RS and gives the relationship RS/R0 return.
def trap(RS):
    return RS/R0
def gutcentration(ratio):
    return (0.51959/ratio)**(1/0.679907)
The function gutcentration() calculated from the ratio of the resistance RS and Roam The breathing alcohol concentration in per thousand. The diagram from the data sheet of the MQ-3 serves as the basis for the formula. Roam If the sensor resistance is exposed to a concentration of 0.4mg pure alcohol in 1l of pure air, it says data sheet.

Image 2: From the resistance to the concentration
The bottom curve is that of alcohol. Both axes of the coordinate system are shared logarithmically, and the points are approximately on a straight line. It can be concluded from this that the context is through a formula with the general representation y = a • xB lets. I read the values from the diagram and entered them in a table in Libre Office Calc.
|
conc |
ratio |
|
0,1 |
2,4 |
|
0,22 |
1,45 |
|
0,4 |
1 |
|
1 |
0,52 |
|
1,6 |
0,4 |
|
2,4 |
0,29 |
|
4 |
0,2 |
|
6 |
0,14 |
|
8 |
0,13 |
|
10 |
0,11 |
From this, the diagram becomes a linear-scaled axes.

Image 3: Resistance ratio versus concentration
How does Calc get the coefficients A and B of the functional? I switch the axes to logarithmic representation, and the graph becomes again. The decades of logarithmic scaling correspond to the linear units in the green coordinate system.
The logarithm of 1 to any base is always 0. Then B * 0 = 0 and remains as the axis section T The straight of the log (a) = 0.52. The climbing factor B I get from the quotient δy / δx. As a δx, I choose a unit on the X axis, i.e. 1. The left catheter of the slope triangle must also be a multiple of the Y unit Icing to be expressed. I calculate Δy, so simply as a quotient from the route lengths of the catheter and the unit Icing in millimeters to 0.678.

Image 4: Diagram evaluation
The exponent is negative because it falls. The equation ratio = a • conc -B I solve after conc on and get conc = (a / ratio) (1 / b). This equation uses the function gutcentration(). I am therefore able to initially be the sensor resistance from a measured value at the sensor output RS to calculate. With this value and the load resistance RL, I get the relationship RS/RO And finally the breathing air concentration.
def awaitrunteum(chip):
    tempo=getting temperature(chip)
    while tempo < Tmin:
        tempo=getting temperature(chip)
        waitheating(10000)
Another way to test the operational readiness is to wait for a certain housing temperature of the MQ-3. From Table I with the program heating.py recorded, you can see that no changes in the output voltage occur from a housing temperature of 22 ° C. The function awaitrunteum() continues to measure the temperature and compares this value with a fixed one Tminthat I set to 25 ° C for safety in the parameter list at the start of the program. This temperature is reached after a good 3.5 minutes at the cold start.
|
Time |
Tempo |
U |
|
sec |
° C |
volt |
|
0 |
19,375 |
0,24 |
|
30 |
20,125 |
0,19469 |
|
60 |
21,25 |
0,183 |
|
90 |
22,125 |
0,181 |
|
120 |
23,065 |
0,18 |
|
150 |
23,8125 |
0,18 |
|
180 |
24,375 |
0,18 |
|
210 |
24,875 |
0,18 |
|
240 |
25,25 |
0,181 |
Column 3 shows that it can also be faster, U volt. Here the input voltage on A0 of the ESP8266 is listed and it does not change significantly after 90 seconds from the start. That uses the function Wait4ustart().
def Wait4ustart(Uold):
    sleep(5)
    U=getval(50)[1]
    sleep(5)
    while Section(Uold-U) > 0.5:
        Uold=U
        U=getval(50)[1]
        print(U)
        D.writer("Wait for Ustart",0,1)
        D.writer("{0: 2.3f} v".format(U),0,2)
        sleep(5)
When I call, I hand over the value that I have before getval() got, or just 0. Then it waits for 5 seconds and a new current voltage value is read. As long as the absolute value of the difference is U and Uold is larger than 0.5, the loop is run through. The new gets old, a new voltage value is fetched and output, both in the terminal and in the OLED display. Wait five seconds for the next round.
Wait4ustart () can monitor two things, the routine can monitor preheating, but also the change in the voltage RL follow when it slowly falls back to the start level after a test. Only then should a new test take place.
Wait4ustart(0)

Umax = 0
testing=Time-out(test duration)
D.clearft(0,1)
D.writer("Blow at Gruen",1,1)
sleep(3)
green.on()
I am waiting for the start of the start condition and set the variable Umax to 0. In the loop we Umax Hold down the maximum achieved sensor voltage. I am activating a timer for the end of the test run - breathing instructions on the display, three seconds break and start with green.
while 1:
    CNT,U=getval(50)
    IF U > Umax:
        Umax=U
    elif U < Umax and testing():
        break
    D.writer("{} cnt".format(intimately(CNT)),0,1)
    D.writer("{0: 2.3f} MV".format(U),0,2)
    print(CNT,U)
    sleep(0.5)
green.off()
red.on()
D.clearft(0,1)
conc=gutcentration(trap(prayer(Umax)))
print("Umax:", Umax, "Concentration: {0: 2.2f} \ Promille".format(conc))
D.writer("Breathing alk {0: 2.2f}*/**".format(conc),0,1)
D.writer("Blood-alk {0: 2.2f}*/**".format(2*conc),0,2)
A new value is read in and if it exceeds the previous maximum, it will be recorded as a new maximum. Otherwise, the loop will leave, albeit the timer testing() has expired. I calculate Umax the sensor resistance so that the ratio RS/RO And with it the breathing air concentration. The output in the terminal and in the OLED display completes the program.

Image 5: Alkomat - structure
A self-test with three clear shows showed that the measurement and calculation of the per thousand value have voted down with a 5% deviation. The calculation of body weight and volume percentage is also only an approximation. Therefore, I do not guarantee the correct way of working on hardware and software. So do not rely on the fact that the result of your replica matches the result of a police Alkomat. It is best to act after the motto "Don't Drink and Drive"!